Return On Investment

Organizations across healthcare, financial services, manufacturing, energy, retail, and more rely on Balihans Enterprise Solutions to modernize operations and drive measurable business outcomes. As a global provider of digital transformation, consulting, and enterprise technology services, Balihans helps companies leverage AI, cloud, data, and security solutions to improve efficiency, enhance customer experiences, and fuel innovation at scale.
With a global delivery model spanning the United States, United Kingdom, and India, and a team of 350+ consultants, Balihans delivers reliable, future-ready solutions anytime, anywhere.
Balihans provides end-to-end IT and business solutions designed to reduce complexity and accelerate results, including:
From strategy and design to implementation and ongoing managed services, Balihans acts as a single, trusted partner for enterprise technology needs.
Balihans helps organizations move beyond fragmented tools and disconnected vendors. With data-driven decision-making, scalable architectures, and security-first solutions, enterprises can modernize faster while staying compliant and resilient in an evolving digital landscape.
No vendor juggling. No guesswork. Just a unified approach to designing, delivering, and managing enterprise solutions—backed by proven methodologies and a global team committed to results.

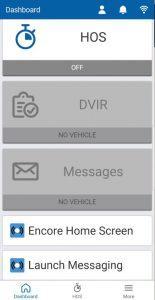
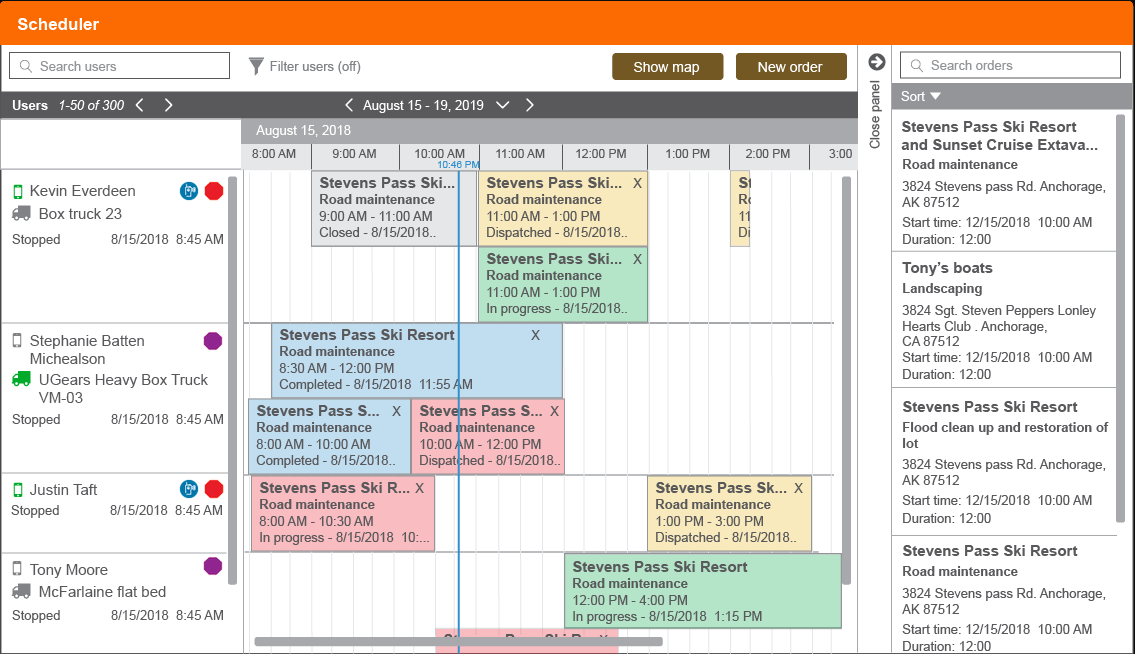
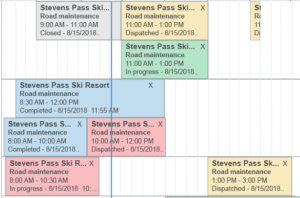
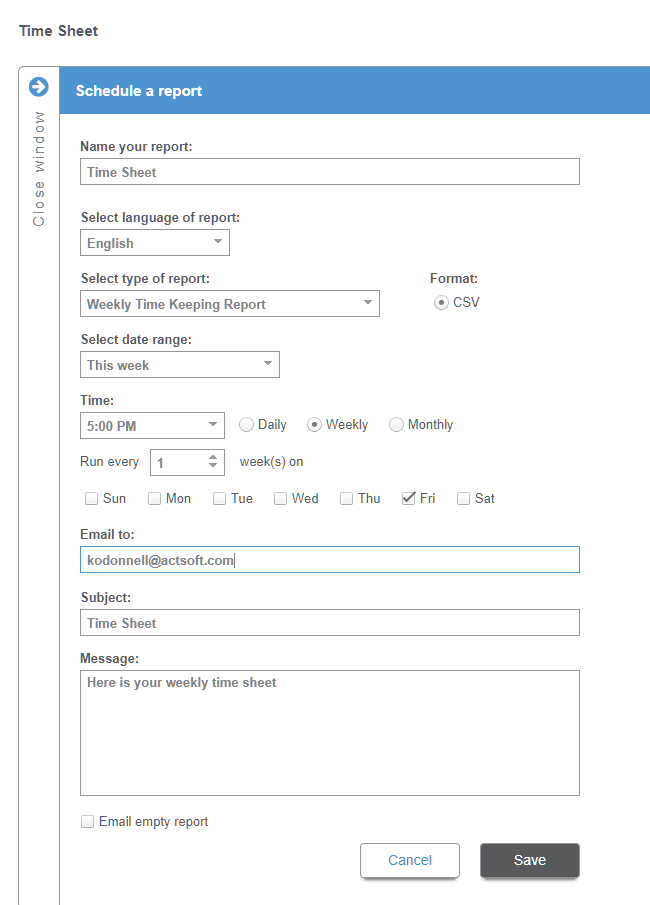
Integrations between Encore and Geotab Drive:
• Encore Launch Screen
-From the press of a button in Geotab Drive, get taken to the Encore main menu.
• Encore Messaging Launch
-Switch directly to Encore’s Intra-Company Messaging feature from Geotab Drive.
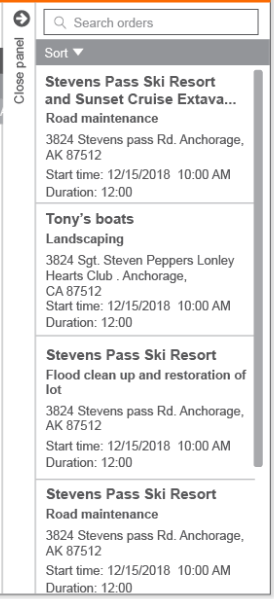
• Encore Orders Launch
-Move from within Geotab Drive to the Job Dispatching module in Encore.
• Encore Timekeeping Launch
-Change to Encore’s Timekeeping module from the Geotab Drive dashboard.

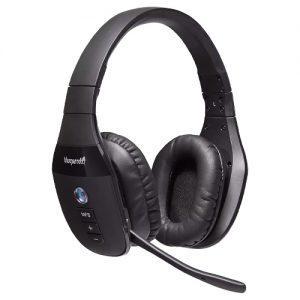
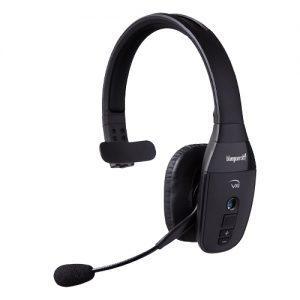
Noise Cancelling Headphones
Every word gets heard, anywhere you go, take advantage of the industry’s leading technolgy in noise canceling headsets.
Blueparrott always delivers impressive sound quality for your calls and music, no matter how much noise your working environment throws at you.
• Up to 24 hours of talk time
• Blocks out 96% of background noise
• Streams Music, Multi media, GPS directions
• Roam up to 300ft from paired Bluetooth devices
![]()
 Actsoft partnered with Odin to provide our solutions overseas, through payment processing integrations. Odin helps us support user management for our software; customers can also purchase our products through Odin’s billing platform.
 VisTracks powers our Electronic Logging Device (ELD) solution, which enables transportation businesses to easily automate their hours of service logs, remain in governmental compliance, and reduce their potential to incur costly fines.
 Integration between Actsoft solutions and BeWhere’s software products is available. Take your team’s asset tracking, cellular data connectivity, and field insight a step further with effective, cross-application compatibility.
 CalAmp tracking devices for vehicles and assets alike are compatible with Actsoft solutions, making it easy for you to efficiently monitor your equipment and fleet cars. Help your team enhance accountability, safety, and savings through a combination of easily installed hardware and intuitive software.
 Our partnership with Uniden is ideal for companies looking to gain advanced diagnostics on their fleets. Uniden’s extensive product listing of car electronics like radios, dash cams, radar detectors, and in-vehicle communicators work in concert with Actsoft’s solutions to better connect your vehicles to the company headquarters.
 Kyocera offers a wide range of mobile devices, ranging in design from traditional phones to ultra-durable handset technology. Actsoft is able to equip organizations in a variety of different industries with solutions for improved business, while Kyocera supplies the technology they can flawlessly operate on.

 Motorola’s mobile technology works in tandem with our solutions to provide extra versatility to your business practices. Coupled with our software’s features, Motorola’s reliable devices make connecting your workforce simpler than ever to do.
 Actsoft and Sanyo teamed up to merge intuitive business management software with the technology of today. This partnership allows us to provide you with all the tools your team needs for improved workflows, better coordination, and optimized productivity.
 We’re able to bundle certain solutions of ours (including our Electronic Visit Verification options) with Samsung devices to help your team achieve as much functionality as possible, while keeping rates affordable. Use these combinations for accurate recordkeeping, improved communication, and smarter data collection in the field.
 Our software is the perfect complement to Apple’s user-friendly technology. Equip your workforce with the devices and solutions it needs for optimized productivity during daily operations with Apple and Actsoft.
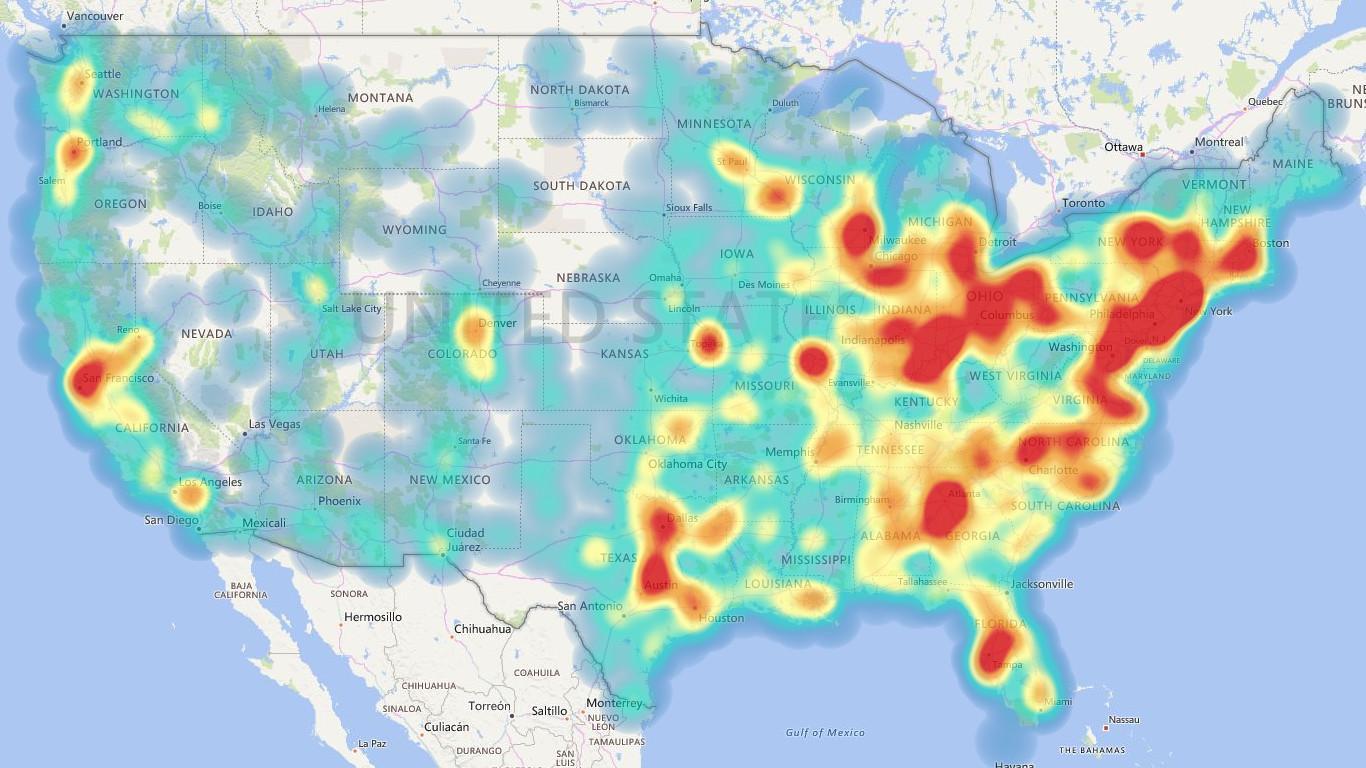
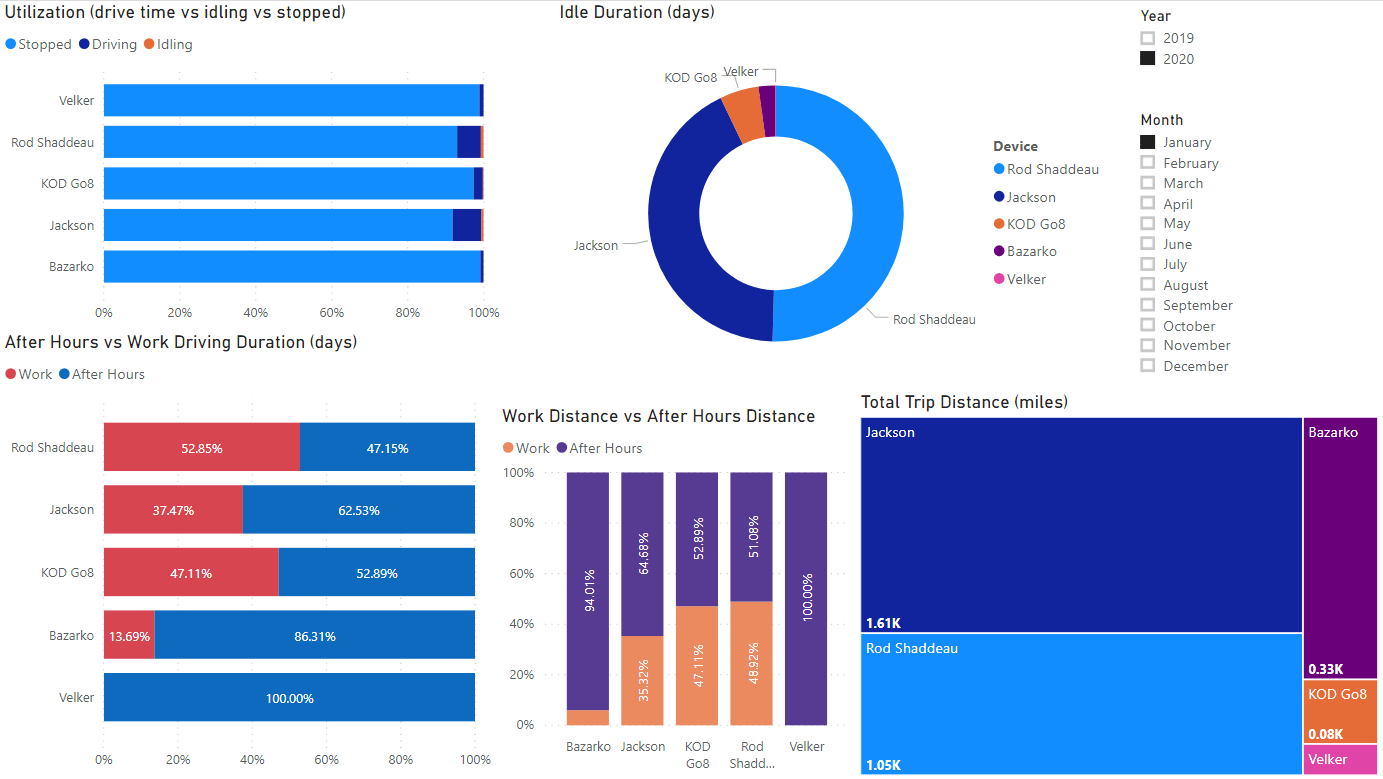
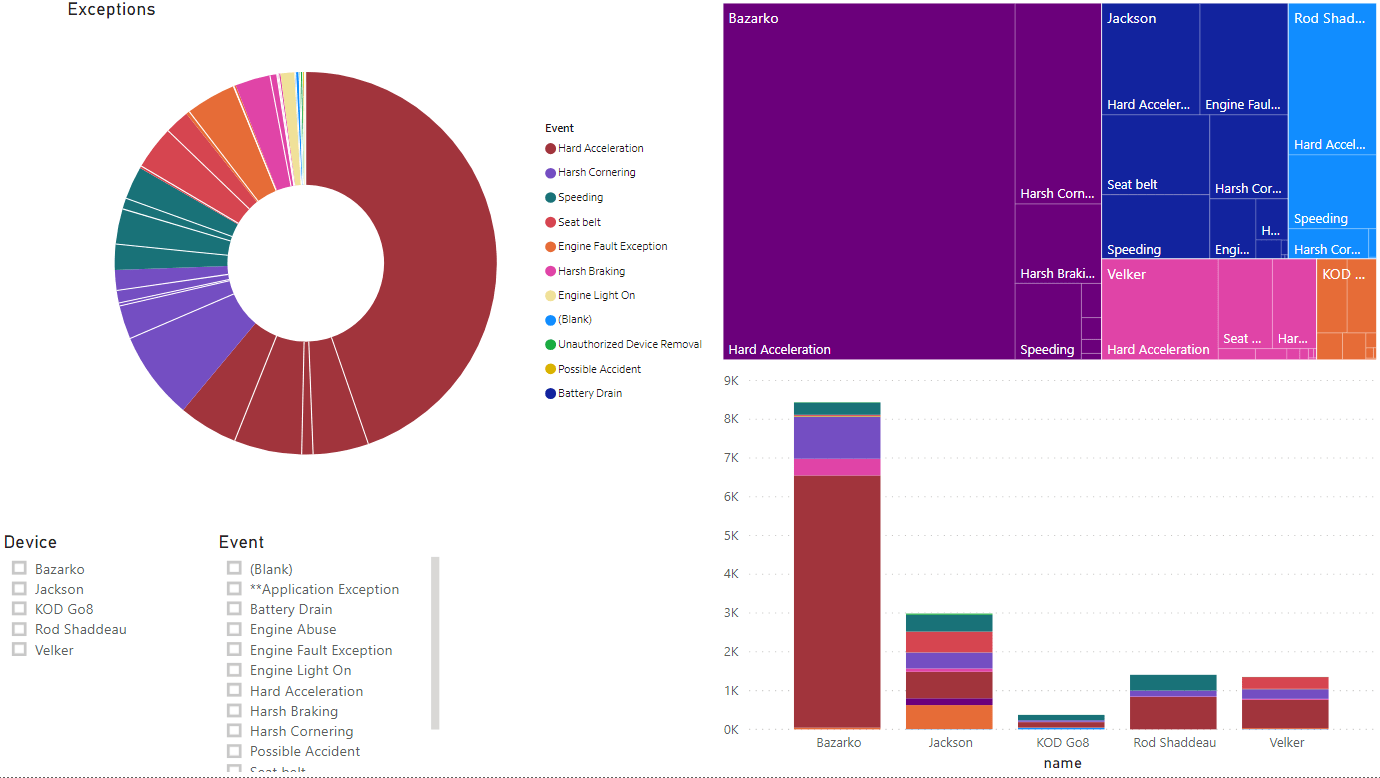
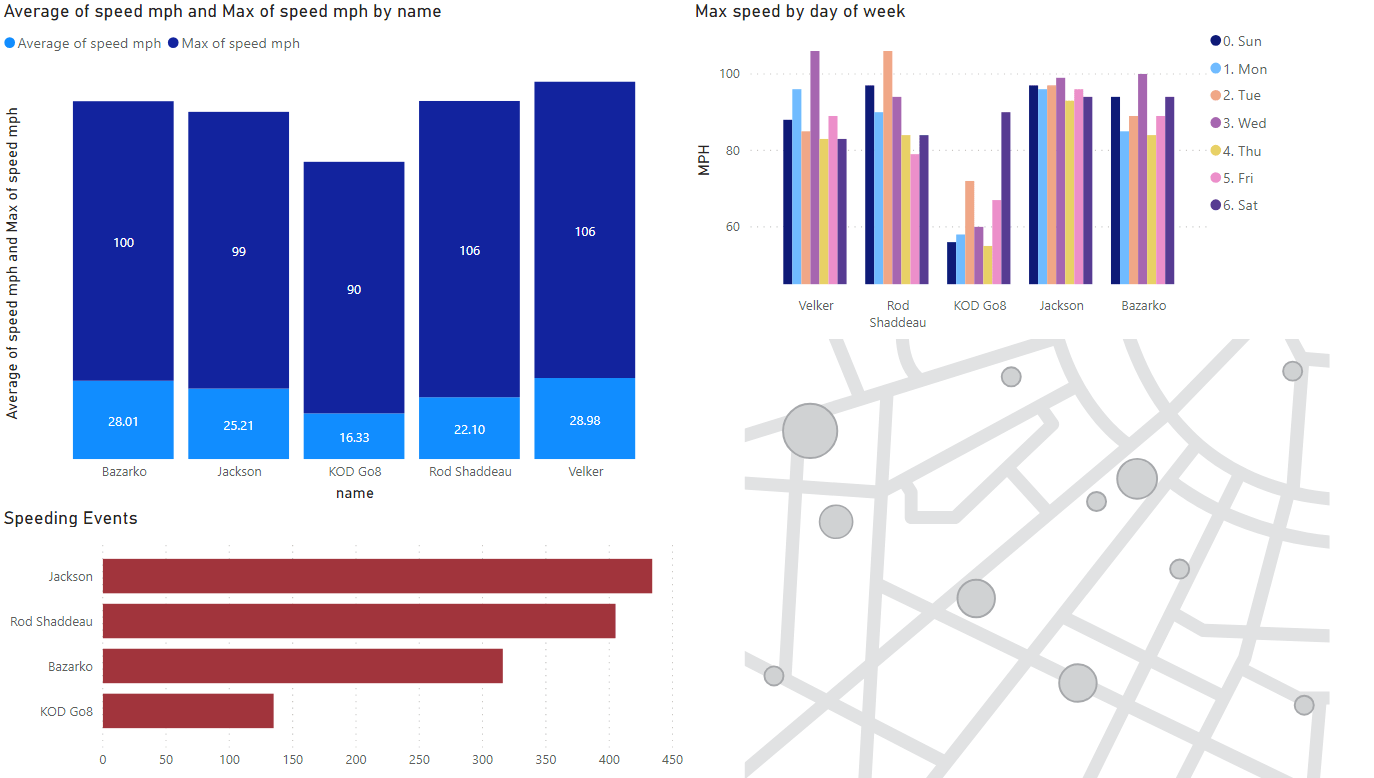

 Gain even greater insight into the daily activities of your fleet using the combination of Geotab and Actsoft. Geotab devices provide detailed data collection and seamless integration with our solutions; learn more about the ways your vehicles are being used daily with the power of this tandem.